고정 헤더 영역
상세 컨텐츠
본문

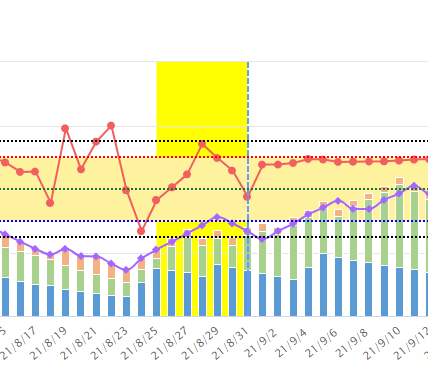
xAxis: { categories: dt , labels: { rotation: -40, y: 30 }
, plotLines: [{color: '#6799FF', width: 2, value: item, zIndex: 10, dashStyle: 'shortdash' }]
, plotBands: [ { from: xPlotBands.fr, to: xPlotBands.to, color: '#ffff01' } ] },
<변수값>
item = x축의 좌표순서 / 밴드의 기준점
xPlotBands.fr = 10 ( x 축의 10번째 좌표부터 )
xPlotBands.to = 20 ( x 축의 20번째 좌표까지 )
반응형
'Component > HighChart' 카테고리의 다른 글
| HighChart Line차트 X , Y축 바꾸기 예제 (0) | 2022.08.26 |
|---|---|
| HighChart 범례(legend) 클릭 이벤트 (0) | 2020.05.18 |


댓글 영역